Web Load Analyst
Optimize your website's performance by understanding its load times with our cutting-edge analysis tool.
Project Overview
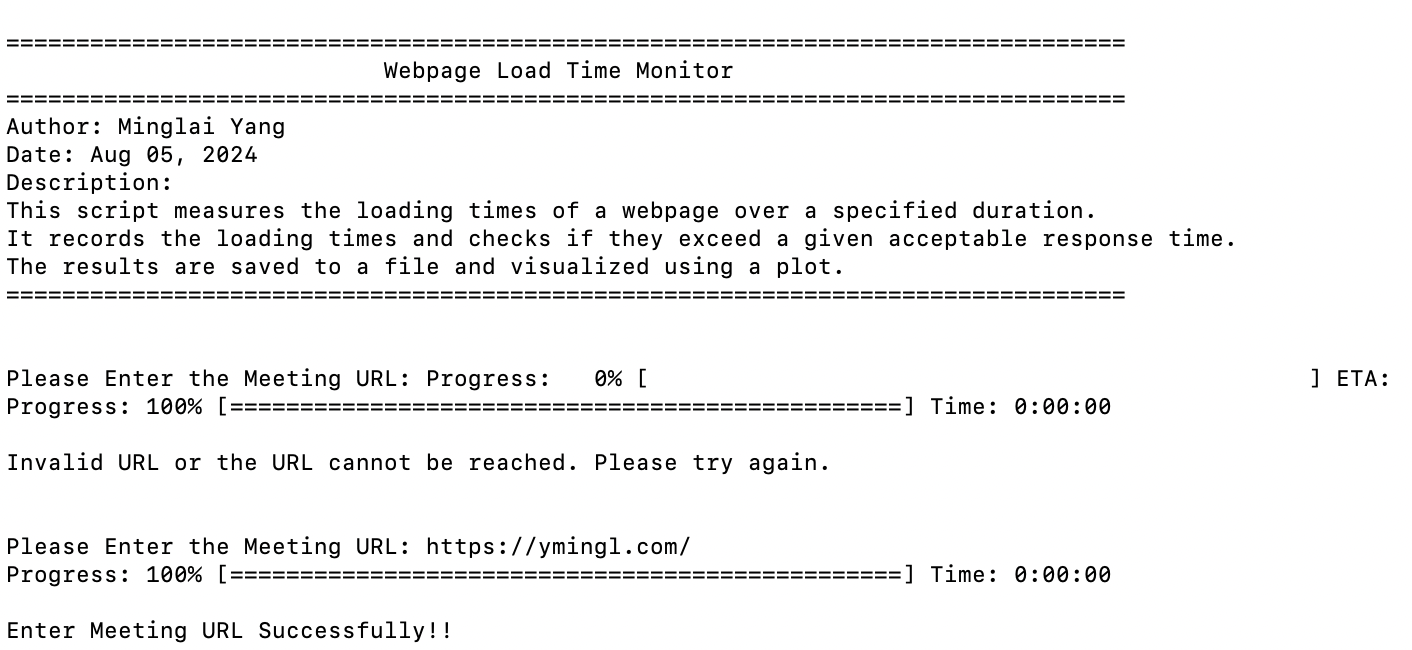
Imagine you’re launching a new marketing campaign and expect a surge in website traffic. How do you ensure your site remains fast and efficient under pressure? Enter the Webpage Loading Time Tester, a sophisticated tool designed to monitor and analyze your website’s performance under various load conditions.
This tool not only measures the time it takes to load your website but also provides detailed visualizations and statistics. These insights help you pinpoint performance bottlenecks and improve user experience. By regularly assessing your website’s load times, you can make informed decisions that enhance its efficiency and effectiveness.
Features
- Detailed Time Measurements: Track how long each page element takes to load.
- Performance Analytics: Get a clear view of your website’s performance trends over time.
- User Impact Simulation: Understand how increased traffic affects load times.
- Real-World Testing: Simulate real user interactions to test server performance under high load conditions. Ensure your server remains operational even when slowed down by heavy traffic.
Ensuring Accurate Load Testing
During peak traffic periods, it’s crucial to conduct accurate load testing to ensure your website can handle the increased load. Our tool provides:
- Stress Test Simulation: Mimic real-world stress conditions to see how your site copes with large volumes of traffic.
- Performance Throttling: Test how your site performs under various network conditions to identify potential slowdowns before they affect your users.
layout: page title: Webpage Loading Time Tester description: Optimize your website’s performance by understanding its load times with our cutting-edge analysis tool. img: assets/img/plot_example.png importance: 2 category: tools giscus_comments: false —
Configuration
You can adjust the following parameters at the start of the script:
- MeetingURL: URL of the webpage to test.
- DURATION_MINUTES: Duration in minutes for which to run the test.
- TIME_LINE: Maximum acceptable response time (seconds).
- PAUSE_TIME_NOT_EXCEED: Sleep time between requests when loading time is acceptable.
- PAUSE_TIME_EXCEED: Sleep time between requests when loading time exceeds the maximum acceptable time.
Please Run them in your own terminal

Output
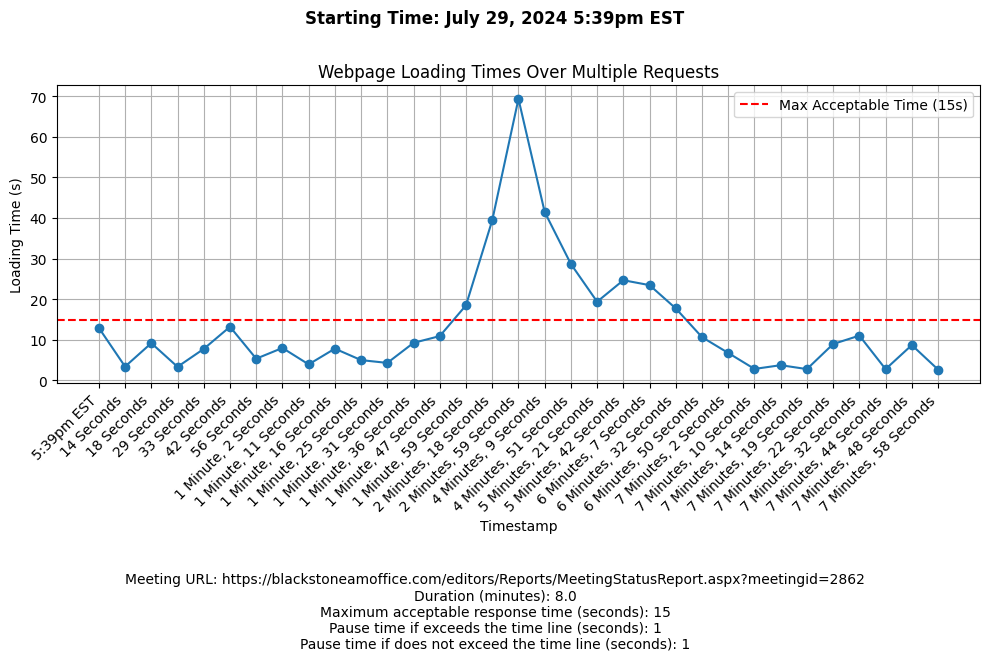
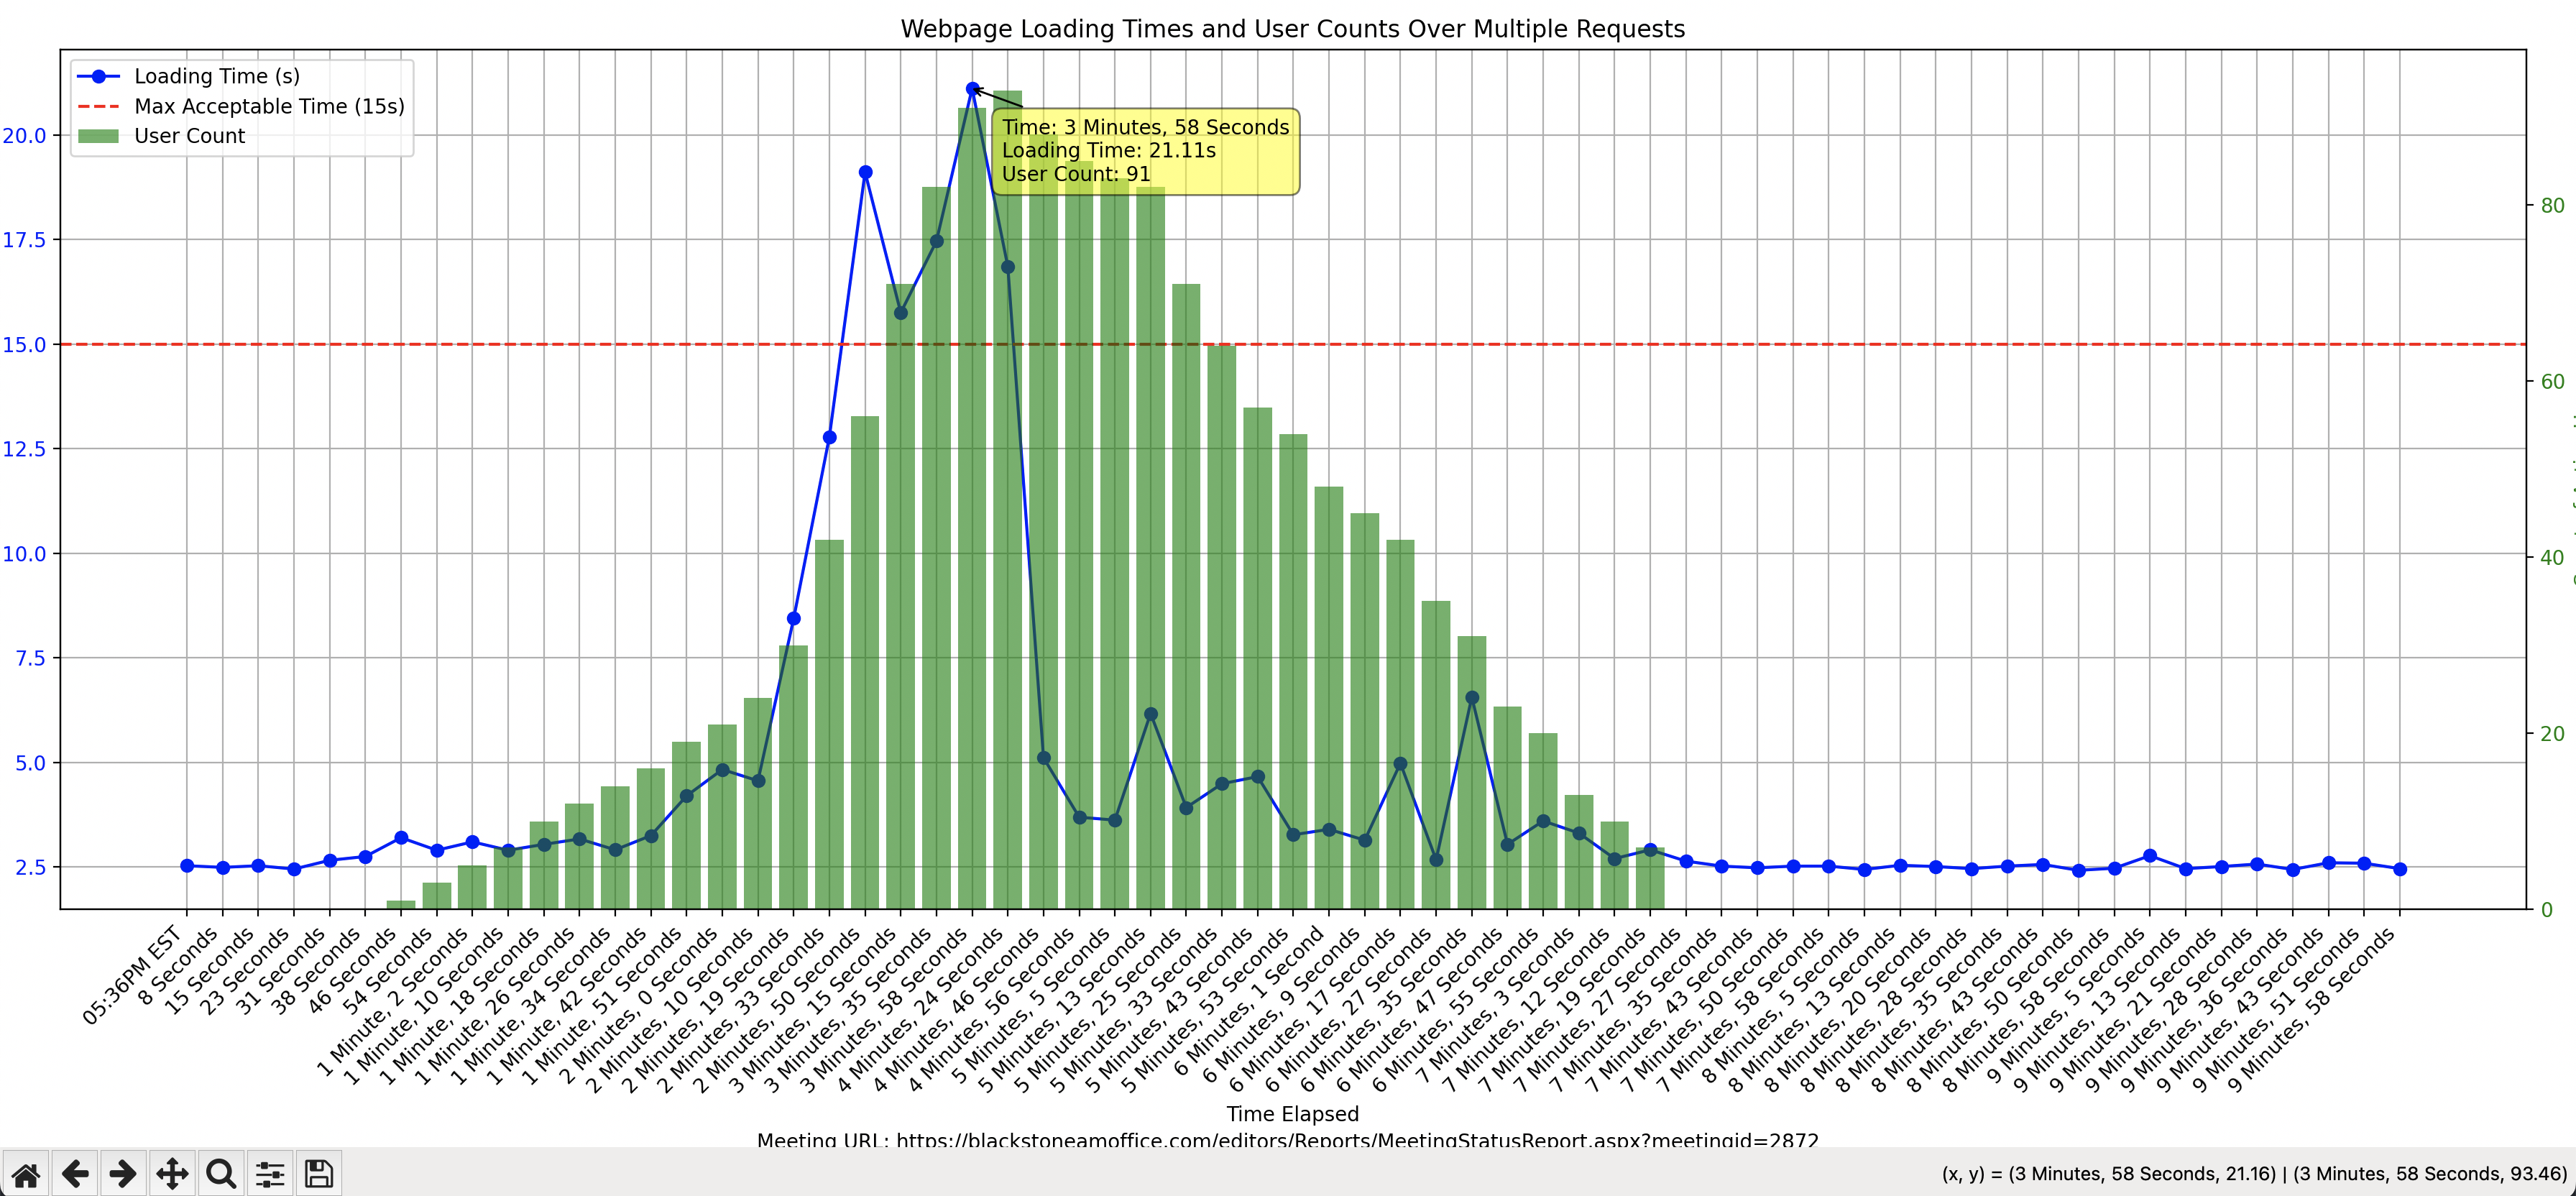
A detailed log of each webpage fetch including timestamps, loading times, and whether the loading time was within acceptable limits. Statistical summary of the webpage’s performance. A plot image file showing the loading times over the session. Another plot image file showing the loading times with active user counts over the session.
Documentation for Handling User Activity Data
Input Format and Data Description:
The active_user_ranges.txt file stores data about user activity in a structured format. Each entry in the file represents a unique user session on a website, detailing when the session began, when it ended, and whether the user successfully reached the final page of their session.
Data Structure:
Each line in the file represents a single user session and contains the following elements, separated by commas: [User ID, Start Time, End Time, Success Indicator]:
- User ID: A unique identifier for the user.
- Start Time: The timestamp marking the beginning of the user session.
- End Time: The timestamp marking the end of the user session.
- Success Indicator: A boolean value (True or False) indicating whether the user successfully reached the final page during the session.
eg. [(11, '2024-08-02 17:42:32', '2024-08-02 17:43:32', False), (24, '2024-08-02 17:43:24', '2024-08-02 17:44:28', False), (1, '2024-08-02 17:41:51', '2024-08-02 17:44:38', True), (2, '2024-08-02 17:41:54', '2024-08-02 17:44:51', True),....]You should copy the output from selenium testing script and concatenate every tuple into one list and paste them into
active_user_ranges.txtfile. In this way, you can typeyesafter you copy all the data and return to terminal.
Example Detailed Log - Copy into Spreadsheet
The data recorded in data/TIMESTAMP/LoadTimes_WEBSITE-NAME_RUN-TIMEmin.txt is structured in a tab-separated format, which is ideal for importing into spreadsheet applications such as Microsoft Excel, Google Sheets, or other similar programs. This allows for further analysis and visualization using spreadsheet tools.
Meeting URL 	 https://blackstoneamoffice.com/editors/Reports/MeetingStatusReport.aspx?meetingid=2873
Duration (minutes) 	2.0
Maximum acceptable response time (seconds) 	5
Pause time if exceeds the time line (seconds) 	1
Pause time if does not exceed the time line (seconds) 	1


Data Records:
Timestamp 	Total Elapsing Time (seconds) 	Total Remaining Time (seconds) 	Loading Times (seconds) 	Pause Each Request (seconds) 	IS ACCEPTABLE? 	Total Counts of Exceeding Time Line
2024-08-05 11:57:13 	0.00 	120.00 	 2.54 	 1 	 True	0
2024-08-05 11:57:17 	3.56 	116.44 	 2.56 	 1 	 True	0
2024-08-05 11:57:20 	7.14 	112.86 	 2.55 	 1 	 True	0
2024-08-05 11:57:24 	10.70 	109.30 	 2.55 	 1 	 True	0
2024-08-05 11:57:27 	14.27 	105.73 	 2.53 	 1 	 True	0
2024-08-05 11:57:31 	17.82 	102.18 	 2.51 	 1 	 True	0
2024-08-05 11:57:34 	21.34 	98.66 	 2.86 	 1 	 True	0
2024-08-05 11:57:38 	25.22 	94.78 	 2.50 	 1 	 True	0
Steps to Import Data into a Spreadsheet:
- Open your preferred spreadsheet. I prefer Google Spreadsheet.
- Create a new spreadsheet and choose the import data option.
- Copy the txt file from your local directory.
- Paste that into your spreasheet.
- Ensure that the data delimiter is set to tab for correct formatting.
Once imported, the data will appear in separate columns, making it easy to perform operations like sorting, filtering, and creating custom charts or graphs.
Visual Example
For a visual reference on how the data looks when formatted in a spreadsheet, see the image below from assets/spreadsheet.png:

This example shows how each column from the text file aligns with the spreadsheet cells, facilitating straightforward analysis of web page loading performance over time.
Example Plot
-
- Below is an example plot showing the webpage loading times over the session:

This plot provides a visual representation of the loading times during each interval, helping to measure loadtime with system performance.
-
- Below is an example plot showing the webpage loading times with active user counts over the session:

This plot provides a visual representation of the loading times alongside the number of active users during each interval, helping to correlate user activity with system performance.
Additional Features
Automatic Saving: When plots are generated, they are automatically saved to your local directory. This ensures that you have a permanent record of the visual data without needing to manually save each image.
Interactive Data Visualization: When viewing the plot, you can interact with it using your mouse. The plot is equipped with a mouse cursor that allows you to hover over specific data points. When you hover over a point, detailed information about that specific time interval and user count is displayed. This feature is particularly useful for closely examining the effects of user load on webpage performance.
Contributing
Feel free to fork this repository and submit pull requests with your improvements. You can also open issues for bugs or feature suggestions.
Conclusion
Optimizing your website’s loading time is crucial for maintaining user satisfaction and engagement. With the Webpage Loading Time Tester, you’re equipped to stay ahead of performance issues and deliver a seamless user experience.
For more information or to start using this tool, visit our GitHub repository.
Contact
For further inquiries or support, please contact Minglai Yang.